Trading chart patterns are necessary for technical analysis because they help traders understand prevailing market conditions and predict future price behavior to capitalize on trading opportunities. There are a lot of trading patterns, and the harmonic pattern is one of the most advanced trading patterns available to traders.
Table of contents
Harmonic patterns have a 5-point shape and break down chaotic price action information for traders to understand. They also generate trading signals that give precise entry and exit points and price targets that create good risk/reward ratios.
Due to their complex nature and the need for them to be drawn precisely, drawing and searching for harmonic patterns by yourself takes a lot of time. To reduce the time spent, harmonic pattern indicators come into play.
What are Harmonic Pattern Indicators
A harmonic pattern indicator is an addition to a chart that automatically identifies harmonic patterns. These indicators are essentially programs that examine market data like market performance, currency price, and volume to determine what direction the market will take in the future and the harmonic patterns that are likely to appear.
It is important to remember that these indicators themselves do not indicate entry or exit points because it is primarily meant to pinpoint patterns and provide an in-depth analysis of the chart. For instance, an indicator like the MetaTrader 4 harmonic pattern indicator can be used to predict any harmonic patterns as it can identify the cypher harmonic pattern, one of the advanced harmonic patterns.
How to spot Harmonic Patterns
Before using indicators to identify harmonic patterns, you can always identify the various patterns yourself if you have the time and are willing to learn. Insert picture
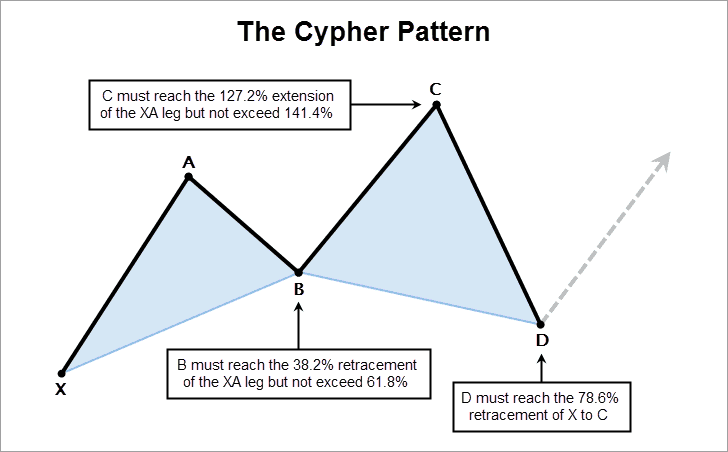
A harmonic pattern has 5 points, and they are usually labeled XABCD with X being the starting point, and each letter represents either a high or low point. However, the D point represents a potential entry point for a trader, and all other points are there to help detect the exact place where the D point will fall.
To identify the harmonic pattern, you need to use the Fibonacci retracement, and there shouldn’t be any indicators on the chart. Your starting point X should be close to the most recent highest or lowest price movement when looking at your chart. The A point doesn’t need to be calculated using Fibonacci, and you can place this point at the end of the initial uptrend or downtrend in the time period you’re using.
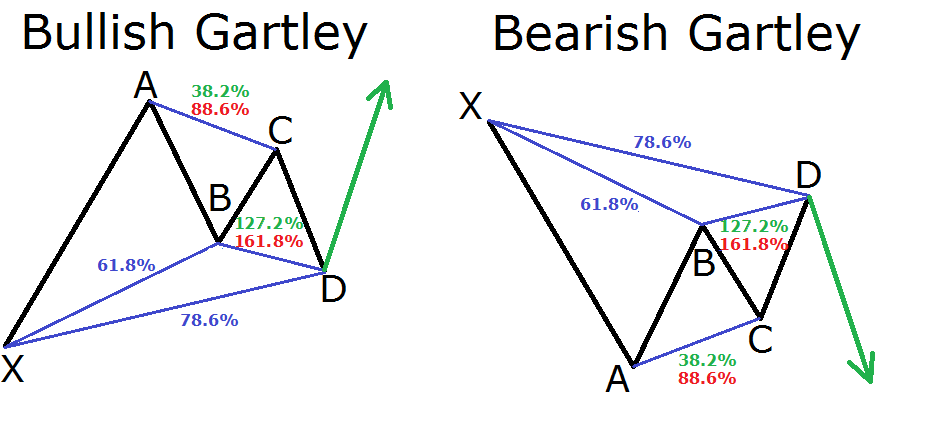
To determine your B point, measure the retracement between X and A points. You can find point C by measuring the retracement between A and B points to determine the type of harmonic pattern it is. For instance, in a Gartley pattern, the retracement of Point B to XA should be between 0.618 and 0.786. Point C of the Gartley pattern should be between 0.618 and 1.
The D point marks the area or zone where there is a high possibility for the price to reverse, called the Potential Reversal Zone. Finally, to get an accurate perception of where point D should be, there should be a 78.6% retracement of X.
When the pattern fully forms, you can decide what type of action to take based on the information presented. For example, using the same Gartley pattern, if A and C are higher than the other points on the chart, you can expect a price decline, and where A and C are lower than the remaining points, there is likely to be a price breakout coming soon.
Best Harmonic Pattern Indicator
Some major trading platforms tend to include indicators like the harmonic pattern indicator in their list of tools available to traders, and among the several indicators you can use, these top the list:
MT4 Harmonic Pattern Indicator
The harmonic pattern indicator for MetaTrader 4 is a comprehensive indicator suitable for both long-term and short-term traders. In addition, it is a multi-timeframe harmonic indicator, which means that it works well with any time frame, whether it is one month or a few minutes.
How does this indicator work? The indicator is programmed to analyze the financial market it is being used in and use existing historical data to show the current pattern that is forming. Insert picture.
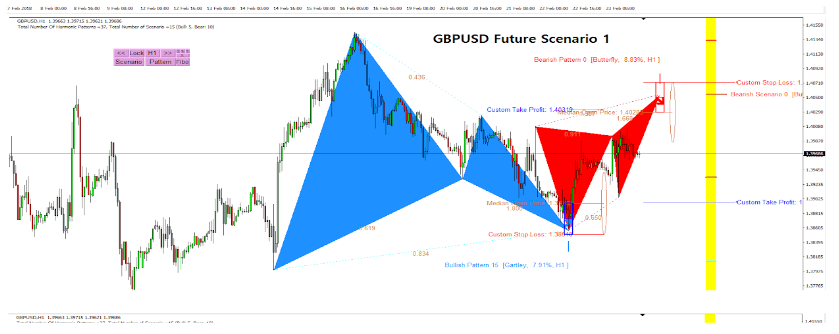
When it is applied to a chart, by default, it displays two triangles that share a common point which is usually point B. The first triangle is formed on the historical data used to discover the pattern, and the second triangle reflects the pattern that is forming, giving a clear idea of where the market is heading.
Along with the triangles, the indicator included a small summary that gives detailed information to help you decide where you should place your stop-loss order and profit target. MetaTrader 4 harmonic indicator also has a feature that allows traders to optimize the indicator and see how various conditions can affect the information shown on the chart; this is one of the many reasons why this indicator is a go-to for many traders.
To top it off, traders don’t need to spend hours learning how to use the indicator or have experience with trading or using indicators before they can find their way around it. Before you start, it is advisable to optimize the indicator to use the conditions you want, but if you are a beginner, you can use the conditions set by the programmer and make changes in the future when you get comfortable with it.
Harmonic Pattern Plus MT5
This indicator was designed to work with MetaTrader 5, and it is a relatively advanced harmonic indicator that was introduced to us in 2014.
It has several features, which include:
- It can recognize 52 bullish and bearish candlestick patterns
- The indicator can automatically detect up to 11 different patterns like the butterfly, bat, cypher, crab, shark, Gartley, deep crab, alternate bat, and more.
- It can instantly detect the Potential Reversal Zone to make identifying point D in a harmonic pattern easier.
- It has a feature that allows traders to lock and unlock patterns to prevent repainting (repainting happens when an indicator changes the values on a chart as new price data comes in).
- It supports multiple time frame pattern scanning.
- Traders receive emails, notifications, and sound alerts whenever there is a change in the parameters that were set.
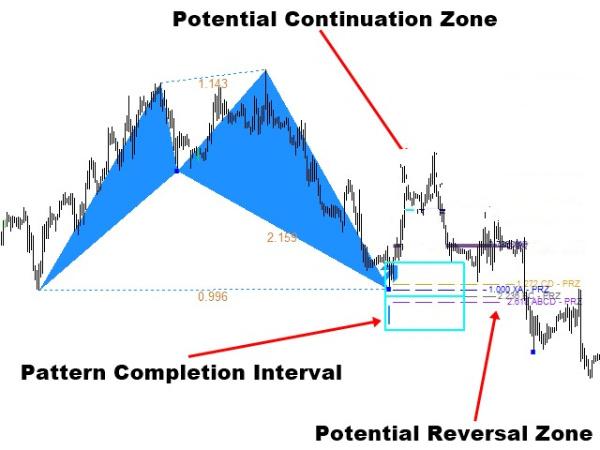
- It has a Pattern Completion Interval that helps to manage risks and ensure precise trading.
Like the version provided for MetaTrader 4, this harmonic indicator is easy to use, but you need to get MetaTrader 5 for Windows before it can run on your laptop.
X3 Chart Pattern Scanner
Previously called Profitable Pattern Scanner, X3 Chart Pattern Scanner is a non-lagging and non-repainting indicator that detects harmonic patterns and Elliott Wave patterns. As a bonus for traders, the chart pattern scanner also detects Japanese Candlestick patterns.
It can automatically detect 11 harmonic patterns and can let traders take a look at past harmonic patterns to formulate trading strategies and see whether the previous patterns have been repeated in the chosen time frame. The X3 Chart Pattern Scanner also has a feature called Potential Continuation Zone that is used to predict future price movement, thereby providing additional information for trading decisions.
When trading with harmonic patterns, the indicator will suggest stop-loss and take profit levels that will increase your profits and manage any risks that could affect the profits you’ve already made. However, it is recommended to use technical indicators like RSI and MACD and fundamental analysis along with this indicator to confirm your entry and exit points before making trades.
Conclusion
The presence of harmonic pattern indicators has made harmonic pattern trading easier because it has reduced the need for traders to spend precious time understanding the complexities of identifying harmonic patterns. Plus, these indicators tend to come with additional features apart from spotting harmonic patterns that can be instrumental to your trading journey, especially as a beginner. If you are not sure which harmonic indicator works best for you, it is necessary to always test the indicator before purchasing it.