

Thursday, September 17, 2026
  • Nasdaq FintechZoom
  • Dow Jones FintechZoom
  • Gold Price FintechZoom
  • Luxury FintechZoom
  • Investment FintechZoom
  • Money FintechZoom
  • Silver Price FintechZoom
[email protected]
 FintechZoom
  • MARKETS
    • Stock Market
      • Penny Stocks
      • Stock Market Guides
      • Breaking Stock Market News
      • Reviews in Stock Market
      • Best Stocks To Buy Now
      • Asian Markets
      • European Markets
      • US Markets
      • Trading
      • Stock Futures
    • Forex Market
    • Bonds & Rates
    • Commodities
      • Brent Crude Oil Price
      • WTI Crude Oil Price
      • Natural Gas Live Prices
      • Gold Live Prices
      • Silver Live Prices
      • Nickel Live Prices
      • Platinum Live Prices
      • Corn Live Prices
      • Wheat Live Prices
    • Exchange Traded Fund (ETF)
    • World Indices
      • DAX PERFORMANCE-INDEX
      • Russel 2000 (RUT)
      • STOXX Europe 600 (SXXP)
      • Euro Stoxx 50
      • CAC 40 Index (FCHI)
      • FTSE 100 Index
      • Nikkei 225 Index
      • HSI – Hang Seng Index
      • NSE Nifty 50 Index
      • NASDAQ Composite Index
      • Dow Jones (INDEXDJX: .DJI)
      • S&P 500 Index
      • ASX – Australian
      • Shanghai Index (SSE)
  • BUSINESS
    • Fintech
    • Technology
      • Cybersecurity
      • Youtube Tools
      • Instagram Tools
      • Social Media
      • Internet
        • Error Pages
        • Is It Down?
        • Download
        • Settings
      • Digital Library
    • Artificial Intelligence
    • Finance
    • Health
    • Real Estate
    • Climate
    • Sports
    • Legal
  • CRYPTO
    • Crypto Guides
      • How To Buy Bitcoin
    • Metaverse
    • Tokens
    • Crypto Reviews
    • NFT : Non-Fungible Tokens
    • Stablecoins
    • Blockchain
    • Ethereum
    • Buy Bitcoin
    • Best Crypto
    • Bitcoin
    • Altcoins
  • MONEY
    • Insurance
    • Mortgages
    • Loans
    • Personal Finances
    • Credit Cards
    • Interest Rates
    • Banking
      • Banks Near Me
      • Payments
      • ATM Near me
      • Best Banks
      • Banks Guides
      • Transfer Money Online
      • Mobile Banking
      • Digital Bank
      • Secure Bank Login
  • ECONOMY
    • Investment
    • Taxes
    • Jobs
    • Inflation
  • LIFESTYLE
    • Travel
    • Luxury
      • Luxury Food & Drink
      • Luxury Watches
      • Luxury Cars
      • Luxury Style
      • Luxury Motors
      • Luxury Travel
      • Luxury Tech
    • Fashion & Beauty
    • Entertainment
      • Gaming
      • Movies
      • Streaming Services
      • eBooks
      • Anime & Cartoons
    • Cars
    • Near Me
    • Life
    • Weather Tomorrow
  • ABOUT US
    • Why Fintech Zoom?
    • What is FintechZoom?
    • Advertise with Us
    • Careers in FintechZoom: Carving Your Path
    • Fintech Zoom Logo
    • FintechZoom PRO
    • Contact FintechZoom.com | Offices, Email & Phone Numbers
  • OUR SERVICESNEW
No Result
View All Result
  • MARKETS
    • Stock Market
      • Penny Stocks
      • Stock Market Guides
      • Breaking Stock Market News
      • Reviews in Stock Market
      • Best Stocks To Buy Now
      • Asian Markets
      • European Markets
      • US Markets
      • Trading
      • Stock Futures
    • Forex Market
    • Bonds & Rates
    • Commodities
      • Brent Crude Oil Price
      • WTI Crude Oil Price
      • Natural Gas Live Prices
      • Gold Live Prices
      • Silver Live Prices
      • Nickel Live Prices
      • Platinum Live Prices
      • Corn Live Prices
      • Wheat Live Prices
    • Exchange Traded Fund (ETF)
    • World Indices
      • DAX PERFORMANCE-INDEX
      • Russel 2000 (RUT)
      • STOXX Europe 600 (SXXP)
      • Euro Stoxx 50
      • CAC 40 Index (FCHI)
      • FTSE 100 Index
      • Nikkei 225 Index
      • HSI – Hang Seng Index
      • NSE Nifty 50 Index
      • NASDAQ Composite Index
      • Dow Jones (INDEXDJX: .DJI)
      • S&P 500 Index
      • ASX – Australian
      • Shanghai Index (SSE)
  • BUSINESS
    • Fintech
    • Technology
      • Cybersecurity
      • Youtube Tools
      • Instagram Tools
      • Social Media
      • Internet
        • Error Pages
        • Is It Down?
        • Download
        • Settings
      • Digital Library
    • Artificial Intelligence
    • Finance
    • Health
    • Real Estate
    • Climate
    • Sports
    • Legal
  • CRYPTO
    • Crypto Guides
      • How To Buy Bitcoin
    • Metaverse
    • Tokens
    • Crypto Reviews
    • NFT : Non-Fungible Tokens
    • Stablecoins
    • Blockchain
    • Ethereum
    • Buy Bitcoin
    • Best Crypto
    • Bitcoin
    • Altcoins
  • MONEY
    • Insurance
    • Mortgages
    • Loans
    • Personal Finances
    • Credit Cards
    • Interest Rates
    • Banking
      • Banks Near Me
      • Payments
      • ATM Near me
      • Best Banks
      • Banks Guides
      • Transfer Money Online
      • Mobile Banking
      • Digital Bank
      • Secure Bank Login
  • ECONOMY
    • Investment
    • Taxes
    • Jobs
    • Inflation
  • LIFESTYLE
    • Travel
    • Luxury
      • Luxury Food & Drink
      • Luxury Watches
      • Luxury Cars
      • Luxury Style
      • Luxury Motors
      • Luxury Travel
      • Luxury Tech
    • Fashion & Beauty
    • Entertainment
      • Gaming
      • Movies
      • Streaming Services
      • eBooks
      • Anime & Cartoons
    • Cars
    • Near Me
    • Life
    • Weather Tomorrow
  • ABOUT US
    • Why Fintech Zoom?
    • What is FintechZoom?
    • Advertise with Us
    • Careers in FintechZoom: Carving Your Path
    • Fintech Zoom Logo
    • FintechZoom PRO
    • Contact FintechZoom.com | Offices, Email & Phone Numbers
  • OUR SERVICESNEW
No Result
View All Result
FintechZoom
No Result
View All Result

Price Return vs Total Return: How to Measure Stock Performance

James Albert by James Albert
September 17, 2026
in Markets
0

FintechZoom > Markets > Price Return vs Total Return: How to Measure Stock Performance

A stock rises from $100 to $108 over a year. One investor calls that an 8% return. Another says the investment made 11%.

Both can be right. The company also paid $3 per share in dividends, and the second investor included that cash.

The difference between price return and total return is easy to explain. It is also easy to miss when a chart, a brokerage statement and an investing video use different numbers for the same stock. Before deciding whether an investment performed well, establish what the percentage actually includes.

Price return measures the share price

Price return shows how much a stock’s price changed between two dates:

Price return = (Ending price − Starting price) ÷ Starting price × 100

For the stock above, the calculation is ($108 − $100) ÷ $100 × 100 = 8%.

RelatedPosts on FintechZoom

Stock Splits Explained: What They Are and How They Affect Your Shares

FintechZoom.com Markets Bonds and Interest Rates: The Guide Most Investors Skip

FintechZoom.com Markets Forex: Understanding the Currency Market

FintechZoom.com Markets Commodities: Energy, Metals and Agriculture Explained

FintechZoom.com Markets Today: How to Read a Trading Session Properly

FintechZoom.com Markets: The Complete Guide to Tracking Global Financial Markets

EDGE Markets vs. Mesh vs. Fun: Comparing the New Money Rails for Prediction Markets

Surety Bond vs. Insurance: Key Differences Contractors Must Know

How should the specification process change when alloy costs rise?

FintechZoom.com Bonds: The Complete Guide to Understanding Bond Markets and Interest Rates

This is useful when examining how the market repriced a company after earnings, a product announcement or a public forecast. It isolates the movement in the share price.

It does not include cash dividends. A company could finish the year at its starting price, pay a dividend and leave a shareholder with a positive return that a price-only chart does not show.

Total return includes the cash paid to shareholders

For a simple investment held throughout the period, with dividends kept as cash, the calculation is:

Total return = (Ending price − Starting price + Dividends per share) ÷ Starting price × 100

Our hypothetical example looks like this:

ItemAmount
Starting share price$100
Ending share price$108
Dividends received per share$3
Price return8%
Total return, with dividends held as cash11%

The investor finishes with a share worth $108 and $3 in dividend cash for each original $100 invested. The example excludes fees, taxes and interest on the cash. It assumes no additional purchases or sales.

FINRA’s explanation of investment returns makes the same distinction between changes in investment value and cash payments received along the way.

Dividends can also soften a loss without eliminating it. If the share ended at $94 and paid the same $3, the price return would be −6% and the total return would be −3%.

Reinvesting dividends adds another step

Keeping a dividend as cash and using it to buy more shares produce different holdings.

Suppose a $3 dividend is reinvested at $100 per share, buying 0.03 additional shares. If the stock later ends the period at $108, the original share plus those extra shares are worth $111.24. The return is 11.24%, assuming no other payouts, fees or taxes.

If the purchase price or subsequent share price changes, so does the result. Reinvestment increases exposure to the stock, including its losses.

A reinvested total-return calculation therefore needs the timing of dividends and the prices at which they buy additional shares. Simply adding the year’s dividends to the final price describes a different cash-flow assumption.
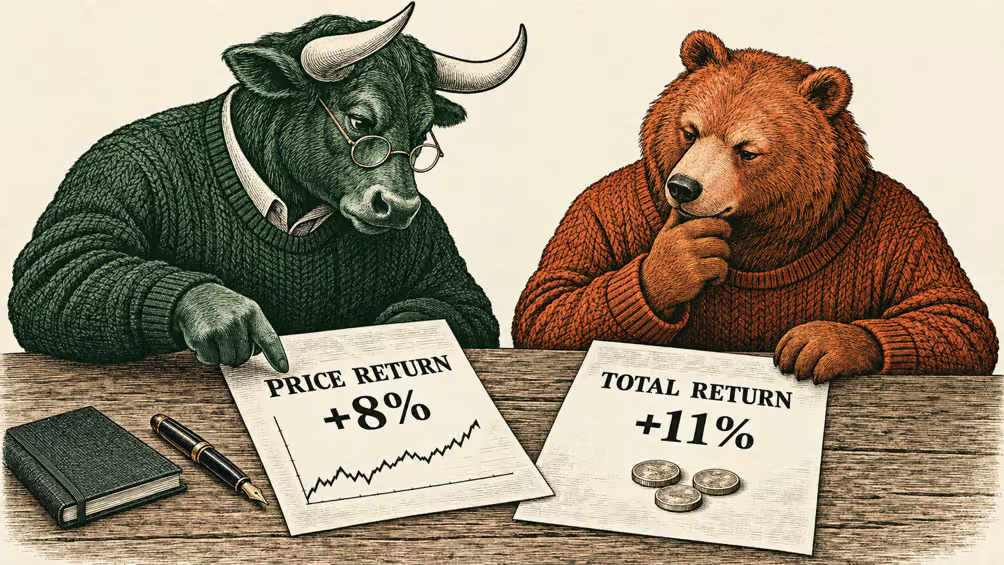
A bull in glasses points to a chart showing +8% price return, while a bear examines a paper showing +11% total return with coins nearby. Both wear jumpers and sit at a table with a pen and notebook. | FintechZoom

Read the chart’s method before judging a stock call

The distinction becomes practical when checking an investment idea from an article or video. A useful record needs the original statement, its date and a clearly defined comparison period.

For example, TheySaidBuy.com links selected public stock commentary to its source video and shows subsequent price changes alongside SPY over the same dates. Those charts measure price movement; they do not include dividend reinvestment or show the speaker’s actual investment return.

That makes the chart useful for checking what happened after a statement. Working out what a shareholder earned requires the dividend treatment and the shareholder’s own transactions as well.

The starting date deserves equal attention. A forecast made before a rally should not be evaluated using a chart that begins after the rally.

Compare a stock with the right version of the benchmark

A stock’s return becomes more informative when compared with a relevant market benchmark. But both sides need the same measurement rules.

S&P Dow Jones Indices explains that the headline S&P 500 is a price return index. Its total return counterpart includes reinvested dividends.

Comparing a stock’s dividend-inclusive return with the index’s price return gives the stock credit for income that the benchmark leaves out.

Use price return against price return when examining price movements. For a dividend-reinvested investment comparison, use total returns calculated on a consistent basis. Match the start date, end date and currency too.

SPY is an ETF tracking the S&P 500. Its market-price change and its return with distributions reinvested are different series. A chart labelled “S&P 500” is not enough to establish which calculation you are looking at.

Four details that can change the answer

Stock splits. A two-for-one split turns one share into two and roughly halves the price per share. That is not a 50% investment loss. Historical comparisons must account for the changed share count.

Adjusted prices. Check the data provider’s definition. A series may adjust for splits, dividends or both. If distributions are already incorporated into a return series, adding them again double-counts the income.

Costs and taxes. A published market return may exclude expenses and taxes that affect what an investor keeps. Know whether a quoted figure is before or after those deductions.

The length of the period. An 11% gain over three years is not an 11% annual return. Without additional cash flows, it works out to roughly 3.54% a year compounded.

These are useful fields to record when monitoring investments, alongside the headline percentage.

Give the number a complete label

“Up 11%” leaves plenty unanswered. “An 11% total return over one year, with dividends held as cash, before fees and taxes” tells the reader what was measured.

Price return explains the movement in the shares. Total return brings distributions into the calculation. A fair comparison states the method and uses it consistently for the stock and its benchmark.

The percentage becomes much more useful once the reader can see how it was earned.

Previous Post

Stock Splits Explained: What They Are and How They Affect Your Shares

Next Post

Undervalued Commodities in Trading: How to Spot Real Opportunities

James Albert

James Albert

James Albert is a personal-finance analyst for FintechZoom and is based in New York. Contact: [email protected]

Related Posts

Two stick-figure robots, one green and one red, face each other on a digital stock market chart background with fluctuating red and white graph lines, symbolising opposing market forces or competition. | FintechZoom

Stock Splits Explained: What They Are and How They Affect Your Shares

September 17, 2026
Stacks of coins arranged in ascending order in front of a blurred financial graph, symbolising growth and increasing profits. | FintechZoom

FintechZoom.com Markets Bonds and Interest Rates: The Guide Most Investors Skip

September 12, 2026

FintechZoom.com Markets Forex: Understanding the Currency Market

September 12, 2026

FintechZoom.com Markets Commodities: Energy, Metals and Agriculture Explained

September 12, 2026

FintechZoom.com Markets Today: How to Read a Trading Session Properly

September 12, 2026

FintechZoom.com Markets: The Complete Guide to Tracking Global Financial Markets

September 12, 2026

EDGE Markets vs. Mesh vs. Fun: Comparing the New Money Rails for Prediction Markets

September 8, 2026

Surety Bond vs. Insurance: Key Differences Contractors Must Know

August 27, 2026

How should the specification process change when alloy costs rise?

August 19, 2026

Leave a Reply Cancel reply

Your email address will not be published. Required fields are marked *

  • About Us
  • Advertise
  • Careers
  • Terms and Conditions
  • Disclaimer – FintechZoom.com
Call us: + 1 917 9939840

© 2016-2026 FINTECHZOOM

No Result
View All Result
  • MARKETS
    • Stock Market
      • Penny Stocks
      • Stock Market Guides
      • Breaking Stock Market News
      • Reviews in Stock Market
      • Best Stocks To Buy Now
      • Asian Markets
      • European Markets
      • US Markets
      • Trading
      • Stock Futures
    • Forex Market
    • Bonds & Rates
    • Commodities
      • Brent Crude Oil Price
      • WTI Crude Oil Price
      • Natural Gas Live Prices
      • Gold Live Prices
      • Silver Live Prices
      • Nickel Live Prices
      • Platinum Live Prices
      • Corn Live Prices
      • Wheat Live Prices
    • Exchange Traded Fund (ETF)
    • World Indices
      • DAX PERFORMANCE-INDEX
      • Russel 2000 (RUT)
      • STOXX Europe 600 (SXXP)
      • Euro Stoxx 50
      • CAC 40 Index (FCHI)
      • FTSE 100 Index
      • Nikkei 225 Index
      • HSI – Hang Seng Index
      • NSE Nifty 50 Index
      • NASDAQ Composite Index
      • Dow Jones (INDEXDJX: .DJI)
      • S&P 500 Index
      • ASX – Australian
      • Shanghai Index (SSE)
  • BUSINESS
    • Fintech
    • Technology
      • Cybersecurity
      • Youtube Tools
      • Instagram Tools
      • Social Media
      • Internet
      • Digital Library
    • Artificial Intelligence
    • Finance
    • Health
    • Real Estate
    • Climate
    • Sports
    • Legal
  • CRYPTO
    • Crypto Guides
      • How To Buy Bitcoin
    • Metaverse
    • Tokens
    • Crypto Reviews
    • NFT : Non-Fungible Tokens
    • Stablecoins
    • Blockchain
    • Ethereum
    • Buy Bitcoin
    • Best Crypto
    • Bitcoin
    • Altcoins
  • MONEY
    • Insurance
    • Mortgages
    • Loans
    • Personal Finances
    • Credit Cards
    • Interest Rates
    • Banking
      • Banks Near Me
      • Payments
      • ATM Near me
      • Best Banks
      • Banks Guides
      • Transfer Money Online
      • Mobile Banking
      • Digital Bank
      • Secure Bank Login
  • ECONOMY
    • Investment
    • Taxes
    • Jobs
    • Inflation
  • LIFESTYLE
    • Travel
    • Luxury
      • Luxury Food & Drink
      • Luxury Watches
      • Luxury Cars
      • Luxury Style
      • Luxury Motors
      • Luxury Travel
      • Luxury Tech
    • Fashion & Beauty
    • Entertainment
      • Gaming
      • Movies
      • Streaming Services
      • eBooks
      • Anime & Cartoons
    • Cars
    • Near Me
    • Life
    • Weather Tomorrow
  • ABOUT US
    • Why Fintech Zoom?
    • What is FintechZoom?
    • Advertise with Us
    • Careers in FintechZoom: Carving Your Path
    • Fintech Zoom Logo
    • FintechZoom PRO
    • Contact FintechZoom.com | Offices, Email & Phone Numbers
  • OUR SERVICES

© 2016-2026 FINTECHZOOM

Are you sure want to unlock this post?
Unlock left : 0
Are you sure want to cancel subscription?