In today’s fast-paced business environment, data is king. And in the finance industry, the ability to effectively analyze data can make or break an organization’s success. This is where analytical dashboards come into play. Analytical dashboards, with their visual displays of complex financial data, have become invaluable tools for finance professionals, enabling them to make informed decisions and drive their company’s performance forward.
With the right analytical dashboard, finance teams can gain real-time insights into revenue growth, cost reduction opportunities, and overall financial health. This empowers them to identify trends, monitor key performance indicators, and spot potential risks or opportunities. By consolidating and presenting data in a user-friendly format, analytical dashboards simplify the process of data analysis, making it accessible to a wider range of stakeholders.
Also read: When Fintech Innovations Meet Modern Manufacturing.
Whether you’re a CFO, financial analyst, or business owner, embracing analytical dashboards can transform your approach to financial performance management. In this article, we will explore the importance of analytical dashboards in finance and delve into the key benefits they offer for driving operational excellence and strategic decision-making in your organization. So, let’s dive in and unlock the power of data-driven finance performance.
The Role of Data Analytics in Finance
Data analytics has become an integral part of finance management, enabling organizations to gain deeper insights into their financial performance. Analyzing large volumes of data manually can be time-consuming and prone to errors. This is where analytical dashboards play a crucial role. These dashboards leverage advanced data visualization techniques to present complex financial data in a visually appealing and easily understandable way. By providing a real-time overview of financial metrics, analytical dashboards empower finance professionals to make data-driven decisions with confidence. They enable organizations to identify patterns, trends, and outliers that can inform strategic planning and drive operational efficiency.
Analytical dashboards also enable finance teams to perform in-depth analysis on specific aspects of financial performance. They allow users to drill down into the underlying data, explore different dimensions, and conduct more granular analysis. This level of detail is essential for identifying the root causes of financial performance issues, pinpointing areas for improvement, and optimizing resource allocation. By harnessing the power of data analytics, finance professionals can uncover hidden insights and make informed decisions that have a direct impact on the company’s bottom line.
In addition to internal data, analytical dashboards can also integrate external data sources, such as market data or industry benchmarks, to provide a comprehensive view of the organization’s financial performance in relation to its peers. This external benchmarking enables finance professionals to identify areas where the company is outperforming or underperforming in comparison to industry standards. Armed with this knowledge, they can develop strategies to capitalize on strengths and address weaknesses, ultimately driving the organization towards financial success.
Benefits of Using Analytical Dashboards in Finance Performance
Implementing analytical dashboards in finance departments offers a multitude of benefits that can significantly enhance financial performance management.
1. Real-time Insights
Analytical dashboards provide finance professionals with real-time visibility into financial data, allowing them to monitor key performance indicators and track the company’s financial health on an ongoing basis. This real-time access to data empowers decision-makers to identify trends, spot potential risks, and seize opportunities as they arise. Whether it’s monitoring revenue growth, tracking cost reduction initiatives, or analyzing profitability metrics, real-time insights enable proactive decision-making that can drive financial success.
2. Enhanced Data Accuracy and Consistency
By automating data collection and consolidation, analytical dashboards minimize the risk of human error and ensure data accuracy and consistency. Manual data entry and spreadsheet-based reporting are prone to mistakes, which can lead to incorrect financial analysis and decision-making. With analytical dashboards, data is pulled directly from various sources, eliminating the need for manual data manipulation and reducing the chances of errors. This ensures that finance professionals are working with reliable and up-to-date information, enabling them to make accurate and informed decisions.
3. Improved Collaboration and Transparency
Analytical dashboards facilitate collaboration and transparency within finance teams and across different departments. By providing a centralized platform for data analysis and reporting, these dashboards enable stakeholders to access and share information easily. This eliminates the need for time-consuming back-and-forth communication and streamlines the decision-making process. With everyone on the same page and working with a common set of data, finance teams can collaborate more efficiently, align their efforts, and drive the company’s financial performance forward.
4. Streamlined Reporting and Compliance
Traditional financial reporting processes can be cumbersome and time-consuming, often involving manual data extraction, manipulation, and formatting. Analytical dashboards streamline the reporting process by automating data extraction and visualization. They enable finance professionals to generate customized reports with a few clicks, saving valuable time and resources. Additionally, these dashboards can be configured to comply with regulatory requirements, ensuring accurate and timely reporting. By reducing the administrative burden associated with reporting, analytical dashboards free up finance professionals to focus on value-added activities and strategic analysis.
5. Scalability and Flexibility
As organizations grow and evolve, their financial reporting and analysis requirements change. Analytical dashboards offer scalability and flexibility, allowing finance teams to adapt to changing needs. These dashboards can accommodate increasing data volumes, new data sources, and evolving reporting requirements. They can be customized to display the specific metrics and KPIs that are relevant to the organization’s financial performance objectives. With the ability to scale and adapt, analytical dashboards provide finance teams with the agility to meet the ever-changing demands of the business environment.
Overall, implementing analytical dashboards in finance departments can revolutionize the way financial performance is managed. By providing real-time insights, enhancing data accuracy, improving collaboration, streamlining reporting, and offering scalability, these dashboards empower finance professionals to make data-driven decisions that drive operational excellence and strategic success. In the next section, we will explore the key metrics and KPIs that finance teams should monitor using analytical dashboards.
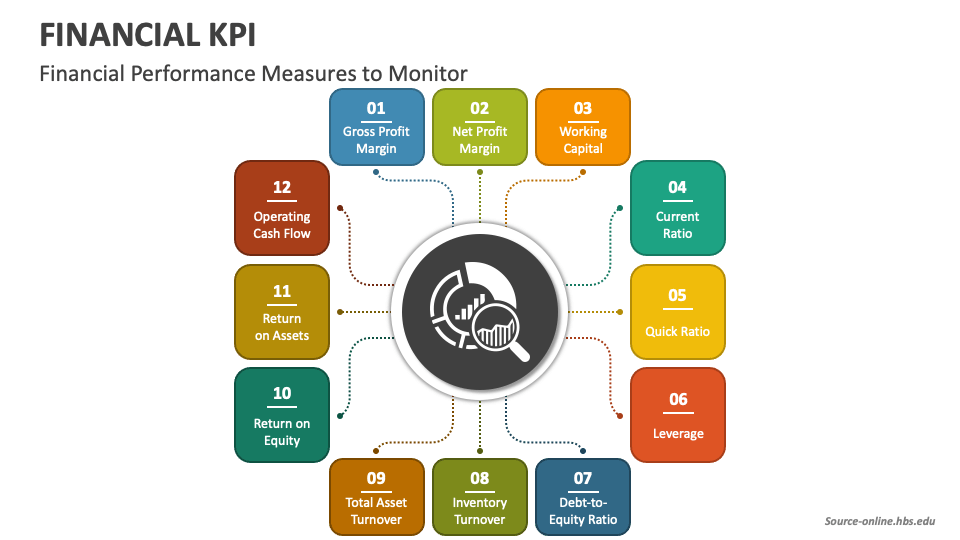
Key Metrics and KPIs for Monitoring Finance Performance
Analytical dashboards are designed to provide finance professionals with a comprehensive overview of the organization’s financial performance. To effectively monitor and manage finance performance, it is crucial to focus on key metrics and key performance indicators (KPIs) that align with the organization’s strategic goals. Here are some essential metrics and KPIs that finance teams should consider tracking using analytical dashboards:
1. Revenue Growth and Profitability
Revenue growth and profitability are fundamental metrics that indicate the financial health and success of an organization. Analytical dashboards can provide real-time visibility into revenue trends, profit margins, and overall profitability. By monitoring these metrics, finance professionals can identify revenue growth opportunities, assess the financial impact of different pricing strategies, and track the overall profitability of the company. This allows them to make data-driven decisions to maximize revenue and optimize profitability.
2. Cost Management and Efficiency
Effective cost management is critical for maintaining a healthy bottom line. Analytical dashboards enable finance teams to track and analyze various cost components, such as operating expenses, cost of goods sold, and overhead costs. By monitoring these costs, finance professionals can identify areas for cost reduction, evaluate the efficiency of different business processes, and optimize resource allocation. This helps organizations achieve greater cost efficiency and improve overall financial performance.
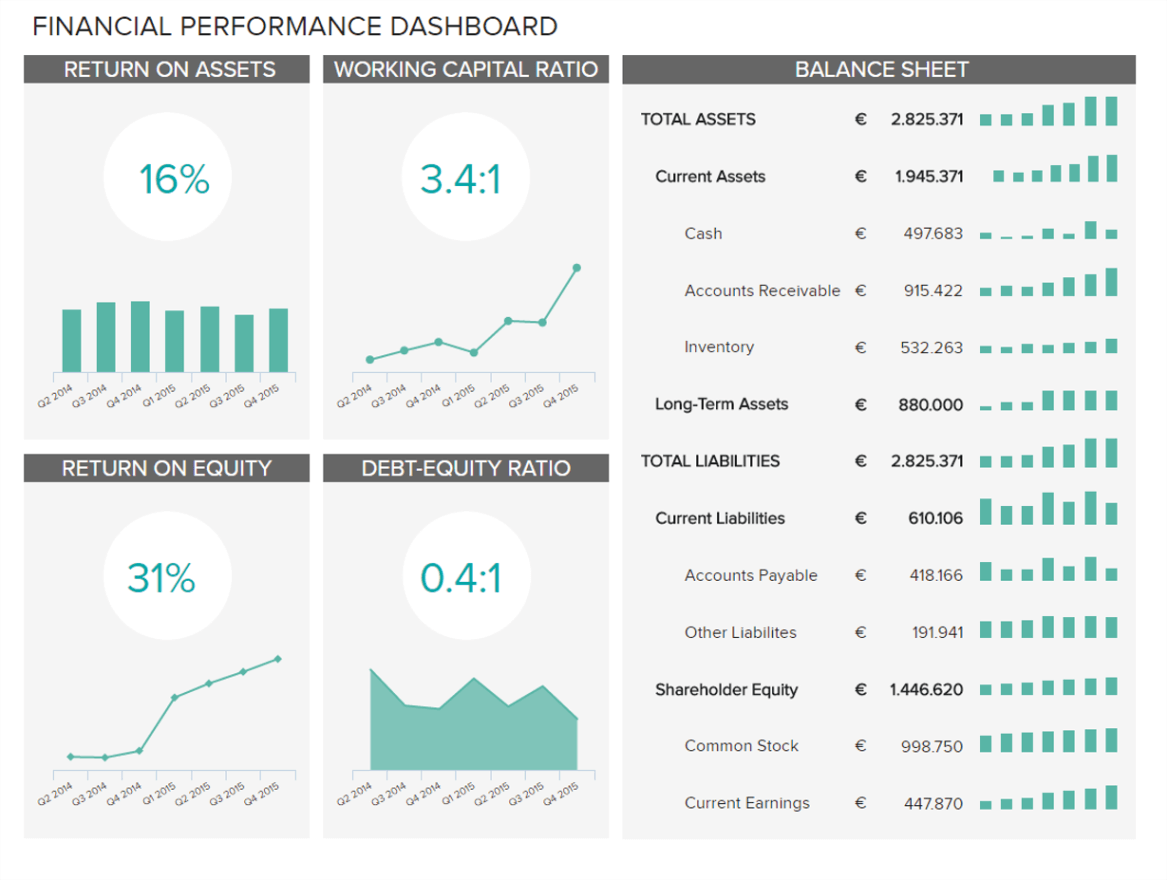
3. Cash Flow and Working Capital
Cash flow is the lifeblood of any organization. Analytical dashboards can provide real-time visibility into cash flow metrics, such as operating cash flow, free cash flow, and working capital. By closely monitoring cash flow, finance professionals can identify potential cash flow issues, manage working capital effectively, and ensure that the organization has sufficient liquidity to meet its financial obligations. This enables them to make informed decisions to optimize cash flow and mitigate financial risks.
4. Financial Ratios and Performance Benchmarks
Analytical dashboards can display various financial ratios and performance benchmarks that provide insights into the organization’s financial health and performance. Examples of financial ratios include profitability ratios (e.g., return on assets, return on equity), liquidity ratios (e.g., current ratio, quick ratio), and efficiency ratios (e.g., inventory turnover, accounts receivable turnover). By comparing these ratios to industry benchmarks or historical data, finance professionals can assess the company’s financial performance relative to its peers and identify areas for improvement.
5. Budget Variance and Forecast Accuracy
Analytical dashboards can help finance teams monitor budget variances and forecast accuracy. By comparing actual financial results to the budgeted amounts and analyzing the reasons behind the variances, finance professionals can identify areas where the organization is overspending or underspending. This allows them to take corrective actions to align actual performance with the budget. Similarly, by tracking forecast accuracy, finance professionals can assess the reliability of their financial projections and make necessary adjustments to improve the accuracy of future forecasts.
By tracking these key metrics and KPIs using analytical dashboards, finance teams can gain a holistic view of the organization’s financial performance. This enables them to identify trends, evaluate the effectiveness of financial strategies, and make data-driven decisions to drive operational excellence and strategic success. In the next section, we will discuss how to choose the right analytical dashboard for your finance team.
How to Choose the Right Analytical Dashboard for Your Finance Team
Choosing the right analytical dashboard for your finance team is a critical decision that can have a significant impact on the effectiveness of financial performance management. Here are some key factors to consider when selecting an analytical dashboard:
1. User-Friendly Interface
The usability of the dashboard is crucial to ensure that finance professionals can easily navigate and analyze financial data. Look for a dashboard that provides an intuitive user interface with drag-and-drop functionality, customizable dashboards, and easy-to-understand visualizations. The dashboard should allow users to drill down into the data, apply filters, and interact with the visualizations to gain deeper insights. A user-friendly interface ensures that finance professionals can make the most of the analytical capabilities of the dashboard without requiring extensive training or technical expertise.
2. Data Integration and Connectivity
An effective analytical dashboard should be able to integrate with various data sources, including internal financial systems, external market data providers, and industry benchmarks. This ensures that finance professionals have access to comprehensive and up-to-date data for analysis. Look for a dashboard that supports data integration through APIs, data connectors, or direct database connections. The ability to connect to different data sources seamlessly enables finance teams to consolidate data from multiple systems and gain a holistic view of the organization’s financial performance.
3. Customization and Scalability
Each organization has unique reporting requirements and specific metrics that are relevant to its financial performance objectives. Look for a dashboard that allows customization, enabling finance teams to configure the dashboard to display the metrics and KPIs that are most important to their organization. The dashboard should support the addition of new data sources, the creation of custom calculations, and the customization of visualizations. Additionally, consider the scalability of the dashboard. As the organization grows, the dashboard should be able to handle increasing data volumes and accommodate evolving reporting needs.
4. Data Security and Governance
Financial data is sensitive and requires robust security and governance measures. When selecting an analytical dashboard, ensure that it provides strong data security features, such as role-based access controls, data encryption, and audit trails. The dashboard should comply with industry standards and regulations, such as GDPR or SOX, to protect sensitive financial information. Additionally, the dashboard should support data governance practices, such as data lineage tracking, data quality management, and data versioning. Data security and governance ensure the integrity and reliability of financial data, giving finance professionals confidence in their analysis and decision-making.
5. Vendor Support and Roadmap
Consider the vendor’s reputation, track record, and customer support services when selecting an analytical dashboard. Look for a vendor that has a strong presence in the finance industry and a proven track record of delivering high-quality products and services. Additionally, assess the vendor’s support channels, such as phone support, email support, or online forums. A responsive and knowledgeable support team can help address any technical issues or answer questions that arise during the implementation and use of the dashboard. Lastly, review the vendor’s product roadmap to ensure that they are committed to ongoing development and innovation, ensuring that the dashboard will continue to meet your organization’s evolving needs in the future.
Choosing the right analytical dashboard is a crucial step in harnessing the power of data-driven finance performance management. By considering factors such as user-friendliness, data integration, customization, security, and vendor support, finance teams can select a dashboard that aligns with their specific needs and empowers them to make informed decisions. In the next section, we will discuss the process of implementing an analytical dashboard in your finance department.
Implementing an Analytical Dashboard in Your Finance Department
An analytical dashboard in your finance department can be a game-changer, offering real-time insights, streamlining processes, and empowering data-driven decision-making. Here’s a guide to help you navigate the implementation:
1. Define your goals and audience:
- What are you hoping to achieve with the dashboard? Improved visibility into cash flow? Identifying spending trends? Forecasting future performance?
- Who will be using the dashboard? Executives, financial analysts, or specific teams? This will influence the design and metrics chosen.
2. Identify relevant data and metrics:
- What KPIs (Key Performance Indicators) align with your goals? Consider revenue, expenses, profitability ratios, liquidity ratios, and market performance indicators.
- Where is your data stored? Ensure clean, accurate, and accessible data sources (ERPs, CRMs, accounting software).
3. Choose the right technology:
- Several dashboarding tools are available: Power BI, Tableau, Google Data Studio, etc.
- Consider factors like: ease of use, data integration capabilities, budget, and user preferences.
4. Design the dashboard:
- Keep it simple and focused. Avoid information overload.
- Use visuals effectively: charts, graphs, and gauges for clear trends and comparisons.
- Ensure mobile-friendliness for access on the go.
5. Implementation and training:
- Involve finance team members in the process for buy-in and familiarity.
- Provide training on navigating the dashboard and understanding the data.
- Set up data refresh schedules to ensure real-time insights.
6. Monitor and optimize:
- Gather feedback from users and iterate on the design.
- Track usage and engagement to see if the dashboard meets needs.
- Stay updated on new features and technologies for continuous improvement.
Additional tips:
- Focus on actionable insights: The dashboard should help users make informed decisions, not just present data.
- Start small and scale: Begin with a basic dashboard and gradually add features.
- Consider data security: Ensure proper access controls and data protection measures.
Implementing an analytical dashboard can be a valuable investment for your finance department. By taking a strategic and user-centric approach, you can create a tool that empowers informed decision-making and drives financial success.
Final Ideas
In today’s data-driven world, financial success hinges on the ability to harness and interpret information swiftly and effectively. Analytical dashboards act as powerful command centers, transforming raw data into actionable insights that illuminate trends, identify opportunities, and inform strategic decisions. By implementing a well-designed dashboard tailored to your specific needs, your finance department gains a critical edge. Increased visibility, streamlined processes, and data-driven decision-making lead to improved cash flow, optimized spending, and ultimately, enhanced financial performance. Remember, the journey to financial clarity starts with a single step – embrace the power of analytics and unlock the full potential of your finance department.