Sunday, May 18, 2025
  • Nasdaq FintechZoom
  • Dow Jones FintechZoom
  • Gold Price FintechZoom
  • Luxury FintechZoom
  • Investment FintechZoom
  • Money FintechZoom
  • Silver Price FintechZoom
[email protected]
 FintechZoom
  • MARKETS
    • Stock Market
      • Penny Stocks
      • Stock Market Guides
      • Breaking Stock Market News
      • Reviews in Stock Market
      • Best Stocks To Buy Now
      • Asian Markets
      • European Markets
      • US Markets
      • Trading
      • Stock Futures
    • Forex Market
    • Bonds & Rates
    • Commodities
      • Brent Crude Oil Price
      • WTI Crude Oil Price
      • Natural Gas Live Prices
      • Gold Live Prices
      • Silver Live Prices
      • Nickel Live Prices
      • Platinum Live Prices
      • Corn Live Prices
      • Wheat Live Prices
    • Exchange Traded Fund (ETF)
    • World Indices
      • DAX PERFORMANCE-INDEX
      • Russel 2000 (RUT)
      • STOXX Europe 600 (SXXP)
      • Euro Stoxx 50
      • CAC 40 Index (FCHI)
      • FTSE 100 Index
      • Nikkei 225 Index
      • HSI – Hang Seng Index
      • NSE Nifty 50 Index
      • NASDAQ Composite Index
      • Dow Jones (INDEXDJX: .DJI)
      • S&P 500 Index
      • ASX – Australian
      • Shanghai Index (SSE)
  • BUSINESS
    • Fintech
    • Technology
      • Cybersecurity
      • Youtube Tools
      • Instagram Tools
      • Social Media
      • Internet
        • Error Pages
        • Is It Down?
        • Download
        • Settings
      • Digital Library
    • Artificial Intelligence
    • Finance
    • Health
    • Real Estate
    • Climate
    • Sports
    • Legal
  • CRYPTO
    • Crypto Guides
      • How To Buy Bitcoin
    • Metaverse
    • Tokens
    • Crypto Reviews
    • NFT : Non-Fungible Tokens
    • Stablecoins
    • Blockchain
    • Ethereum
    • Buy Bitcoin
    • Best Crypto
    • Bitcoin
    • Altcoins
  • MONEY
    • Insurance
    • Mortgages
    • Loans
    • Personal Finances
    • Credit Cards
    • Interest Rates
    • Banking
      • Banks Near Me
      • Payments
      • ATM Near me
      • Best Banks
      • Banks Guides
      • Transfer Money Online
      • Mobile Banking
      • Digital Bank
      • Secure Bank Login
  • ECONOMY
    • Investment
    • Taxes
    • Jobs
    • Inflation
  • LIFESTYLE
    • Travel
    • Luxury
      • Luxury Food & Drink
      • Luxury Watches
      • Luxury Cars
      • Luxury Style
      • Luxury Motors
      • Luxury Travel
      • Luxury Tech
    • Fashion & Beauty
    • Entertainment
      • Gaming
      • Movies
      • Streaming Services
      • eBooks
      • Anime & Cartoons
    • Cars
    • Near Me
    • Life
    • Weather Tomorrow
  • ABOUT US
    • Why Fintech Zoom?
    • What is FintechZoom?
    • Advertise with Us
    • Careers in FintechZoom: Carving Your Path
    • Fintech Zoom Logo
    • FintechZoom PRO
    • FintechZoom Contacts: Best Ways to Connect with FintechZoom
  • OUR SERVICESNEW
No Result
View All Result
FintechZoom
No Result
View All Result

Bullish Engulfing Patterns: Identifying Profitable Entry Points

James Albert by James Albert
August 23, 2023
in Hot Investments, Investments, Stocks, Trading
0

FintechZoom > Economy > Investments > Hot Investments > Bullish Engulfing Patterns: Identifying Profitable Entry Points

In the world of technical analysis, candlestick patterns play a crucial role in identifying potential trading opportunities. One such pattern that traders often look out for is the bullish engulfing pattern. This powerful candlestick formation can provide valuable insights into market sentiment and help traders identify profitable entry points. In this article, we will delve into the intricacies of bullish engulfing patterns, understand how to identify them on a stock chart, and explore their significance in price action.

Understanding Candlestick Patterns in Technical Analysis

Before we dive into the specifics of bullish engulfing patterns, let’s first gain a solid understanding of candlestick patterns and their role in technical analysis. Candlestick charts, developed by Japanese rice traders centuries ago, provide a visual representation of price movements over a given time period. Each candlestick consists of a body and two wicks (also known as shadows). The body represents the price range between the opening and closing prices, while the wicks depict the high and low prices for the period.

How to Use a Bullish Engulfing Candle to Trade Entries | FintechZoom

What is a Bullish Engulfing Pattern?

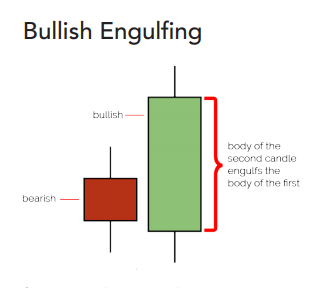
This pattern is a two-candlestick formation that signals a potential trend reversal from bearish to bullish. It occurs when a small bearish candlestick is followed by a larger bullish candlestick that engulfs the entire body of the previous candlestick. This pattern suggests that buying pressure has overwhelmed selling pressure, indicating a shift in market sentiment. This pattern is considered a strong bullish signal and is often used by traders to identify potential buying opportunities.

What is a Bullish Engulfing Pattern? | FintechZoom

How to Identify a Bullish Engulfing Pattern on a Stock Chart

To spot a bullish engulfing pattern on a stock chart, follow these steps:

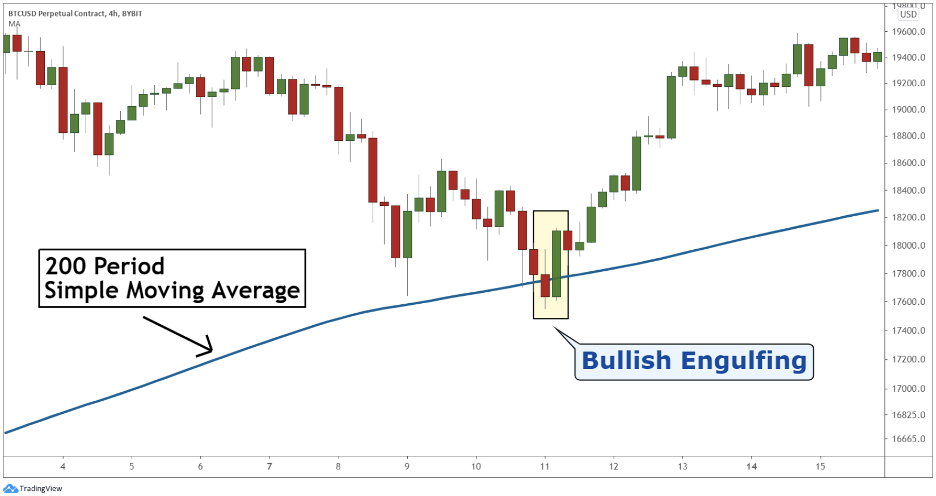
  1. Look for a downtrend: A bullish engulfing pattern is most effective when it occurs after a prolonged downtrend. This indicates a potential reversal in the market.
  2. Identify a small bearish candlestick: The first candlestick in the pattern should be smaller in size and have a bearish (red or black) body.
  3. Look for a larger bullish candlestick: The second candlestick should be larger in size and have a bullish (green or white) body that engulfs the entire body of the previous candlestick.
  4. Confirm the pattern: Ensure that the bullish candlestick closes above the high of the bearish candlestick, confirming the engulfing pattern.

The Significance of These Patterns in Price Action

These patterns carry significant importance in price action as they indicate a shift in market sentiment from bearish to bullish. When this pattern occurs after a downtrend, it suggests that buying pressure has gained momentum, potentially leading to a trend reversal. Traders often interpret this as a signal to enter into long positions or to close out short positions. The larger the bullish candlestick in the pattern, the stronger the signal and the higher the probability of a price reversal.

Using Bullish Engulfing Patterns to Identify Profitable Entry Points

Traders can utilize these patterns to identify profitable entry points by combining them with other technical analysis tools. One common approach is to wait for the confirmation of the pattern by observing the price action in the following candles. If the price continues to rise after the engulfing pattern, it may be a signal to enter a long position. Additionally, traders can use support and resistance levels, moving averages, and other chart patterns to further validate the potential entry points suggested by the bullish engulfing pattern.

Examples of Bullish Engulfing Patterns in Different Market Conditions

Let’s take a look at a few examples of bullish engulfing patterns in different market conditions to better understand their significance:

Example 1: Bullish Engulfing during an Uptrend

In this scenario, the market is already in an uptrend, and this pattern forms. This pattern can be seen as a continuation signal, indicating that the upward momentum is likely to persist. Traders can consider adding to their existing long positions or entering new positions.

Example 2: Bullish Engulfing after a Downtrend

In this case, the market has been experiencing a prolonged downtrend, and a bullish engulfing pattern emerges. This pattern suggests a potential reversal in the market sentiment, with buying pressure overpowering selling pressure. Traders may take this as an opportunity to enter long positions or close out their short positions.

Example 3: Bullish Engulfing at a Support Level

Here, the market is approaching a significant support level, and this pattern forms. This pattern, combined with the support level, can provide a strong signal for a potential price reversal. Traders may consider entering long positions at the support level, expecting a bounce in price.

The Psychology Behind Bullish Engulfing Patterns and Market Sentiment

The psychology behind bullish engulfing patterns lies in the shift of market sentiment from bearish to bullish. During a downtrend, sellers dominate the market, resulting in falling prices. However, when this pattern forms, it indicates that buyers have stepped in and overwhelmed the sellers. This shift in market sentiment can be attributed to various factors such as positive news, strong earnings reports, or favorable economic data. Traders who recognize this change in sentiment can capitalize on the potential price reversal and profit from the subsequent upward movement.

Confirming These Patterns with Other Technical Indicators

While bullish engulfing patterns are powerful on their own, traders often use other technical indicators to confirm their validity. Some commonly used indicators include:

  • Relative Strength Index (RSI): A momentum oscillator that measures the speed and change of price movements. An oversold RSI reading combined with a bullish engulfing pattern can strengthen the bullish signal.
  • Moving Averages: Traders often use moving averages to identify trends and potential support or resistance levels. When a bullish engulfing pattern occurs near a rising moving average, it adds further confirmation to the potential trend reversal.
  • Volume: Increasing volume during the formation of a bullish engulfing pattern suggests strong buying pressure, reinforcing the bullish signal. Traders should look for above-average volume accompanying the pattern for greater reliability.

Tips for Successfully Trading Bullish Engulfing Patterns

Here are some useful tips to enhance your trading success when using bullish engulfing patterns:

  1. Combine with other technical analysis tools: Utilize other indicators, chart patterns, and support/resistance levels to confirm the validity of the this pattern.
  2. Consider the overall market trend: these patterns are more effective in an established downtrend. Always analyze the broader market context before placing trades based on this pattern.
  3. Practice proper risk management: Set appropriate stop-loss levels to protect your capital in case the trade doesn’t go as expected. Implement a risk-to-reward ratio to ensure your potential profits outweigh potential losses.
  4. Continuously learn and adapt: Stay updated with market trends, news, and changes in market sentiment. Adapt your trading strategy accordingly to maximize your chances of success.

Common Mistakes to Avoid When Trading Bullish Engulfing Patterns

While bullish engulfing patterns can be highly profitable, it’s essential to avoid common mistakes that can lead to trading losses. Here are a few pitfalls to watch out for:

  1. Ignoring the overall market trend: Failing to consider the broader market trend can result in false signals and poor trade execution. Always analyze the market context before making trading decisions.
  2. Overlooking confirmation signals: Don’t solely rely on the bullish engulfing pattern. Confirm its validity with other technical indicators and price action signals to increase the reliability of your trades.
  3. Neglecting risk management: Proper risk management is crucial in trading. Set stop-loss levels and adhere to them to protect your capital. Avoid risking a large portion of your account on a single trade.
  4. Failing to adapt to changing market conditions: Markets are dynamic and constantly evolving. Adjust your trading strategy as market conditions change to stay ahead of the game.

FAQs

What is a bullish engulfing pattern?

A bullish engulfing pattern is a candlestick pattern that signals a potential reversal from a downtrend to an uptrend. It is formed when a large white candle engulfs a smaller black candle. The white candle indicates that buyers have taken control of the market and are pushing prices higher.

What are the requirements for a bullish engulfing pattern?

To be considered a valid pattern, the following requirements must be met:

* The first candle must be a black candle.
* The second candle must be a white candle.
* The body of the white candle must completely engulf the body of the black candle.
* The white candle must close above the open of the black candle.

What is the significance of a bullish engulfing pattern?

It´s a reversal pattern, which means that it signals a change in the direction of the trend. In this case, the pattern signals a change from a downtrend to an uptrend.

How can I trade the bullish engulfing pattern?

One way to trade with this is to buy the asset at the open of the white candle. This is because the pattern suggests that the buyers are in control and that prices are likely to continue to rise.

Another way to trade the pattern is to wait for a confirmation candle. A confirmation candle is a candle that follows the bullish engulfing pattern and confirms the reversal. The confirmation candle can be either a white candle or a green candle.

What are the limitations of the bullish engulfing pattern?

This is not always reliable. It is important to use other technical indicators to confirm the pattern before making a trading decision.

What are some other reversal patterns?

Some other reversal patterns include the:

* Piercing pattern
* Harami pattern
* Morning star pattern
* Evening star pattern

Conclusion: Harnessing the Power of Bullish Engulfing Patterns for Profitable Trades

Bullish engulfing patterns are valuable tools in a trader’s arsenal, offering insights into potential trend reversals and profitable entry points. By understanding how to identify and interpret these patterns, traders can make informed trading decisions and increase their chances of success. Remember to combine this pattern with other technical analysis tools, consider the overall market trend, and practice proper risk management. With these strategies in place, you can harness the power of these patterns to achieve profitable trades and navigate the dynamic world of the financial markets.

RelatedPosts on FintechZoom

Defense Stocks Soar: Is This The Perfect Time to Invest in 2025?

Why is it Important to Choose the Best Share Trading Platform?

Things to Consider When Buying an Apartment

GMZ Global Experts Share Why a Regulated Broker Matters for Your Trading Success

FintechZoom.com Insights: How Is Data Used In Modern Investing?

Andy Gitipityapon Talks DSTs and Alternative Investment Vehicles

Day Trading Made Easy: How FintechZoom.com Supports Active Traders

How to Master Equity Capital Markets: A Beginner’s Guide That Actually Makes Sense

Online Trading Broker FXGiants Enhances Trader Experience with Bonus Programs

Trade War Intensifies: China Hits U.S. Imports With 15% Tariffs

Tags: Bullish candlebullish candlestickBullish candlestick analysisBullish candlestick behaviorBullish candlestick chartBullish Candlestick FormationBullish candlestick patternBullish candlestick signalBullish candlestick validationBullish candlestick validation analysisBullish EngulfingBullish engulfing candlestickBullish engulfing confirmationBullish Engulfing PatternBullish engulfing pattern analysisBullish engulfing pattern behaviorBullish engulfing pattern behavior analysisBullish engulfing pattern movementBullish engulfing pattern movement analysisBullish engulfing pattern psychologyBullish engulfing pattern psychology behaviorBullish engulfing pattern psychology behavior analysisBullish engulfing pattern psychology behavior validationBullish engulfing pattern psychology movementBullish engulfing pattern psychology movement analysisBullish engulfing pattern psychology movement validationBullish engulfing pattern sentimentBullish engulfing pattern sentiment analysisBullish engulfing pattern sentiment psychology analysisBullish engulfing pattern validationBullish engulfing psychologyBullish engulfing signalBullish engulfing signal analysisBullish engulfing signal confirmationBullish engulfing signal psychologyBullish engulfing validationBullish marketBullish market analysisBullish market behaviorBullish market movementBullish market psychologyBullish market psychology analysisBullish market psychology behaviorBullish market psychology movementBullish market psychology validationBullish market sentimentBullish market sentiment analysisBullish market sentiment behaviorBullish market sentiment behavior analysisBullish market sentiment movementBullish market sentiment movement analysisBullish market sentiment movement behaviorBullish market sentiment movement psychologyBullish market sentiment movement psychology analysisBullish market sentiment movement psychology behaviorBullish market sentiment movement psychology validationBullish market sentiment movement validationBullish market sentiment psychologyBullish market sentiment psychology analysisBullish MomentumBullish momentum behaviorBullish momentum signalBullish patternBullish pattern confirmationBullish pattern recognitionBullish pressureBullish price actionBullish price confirmationBullish price movementBullish price movement analysisBullish price movement behaviorBullish price movement psychologyBullish price movement psychology analysisBullish price movement psychology behaviorBullish price movement psychology behavior analysisBullish price movement psychology movementBullish price movement psychology movement analysisBullish price movement psychology validationBullish price movement psychology validation analysisBullish price movement validationBullish price movement validation analysisBullish price trendBullish price trend analysisBullish price trend movementBullish ReversalBullish reversal behaviorBullish reversal confirmationBullish reversal movementBullish Reversal SignalBullish reversal trendBullish sentimentBullish SignalBullish TrendBullish trend analysisBullish trend behaviorBullish trend behavior analysisBullish trend confirmationBullish trend continuationBullish trend continuation analysisBullish trend continuation behaviorBullish trend continuation signalBullish trend continuation signal confirmationBullish trend movementBullish trend movement analysisBullish trend movement psychologyBullish trend movement validationBullish trend psychologyBullish trend psychology analysisBullish trend psychology behaviorBullish trend psychology behavior analysisBullish trend psychology behavior movementBullish trend psychology movementBullish trend psychology movement analysisBullish trend psychology movement psychologyBullish trend psychology movement validationBullish trend psychology validationBullish trend psychology validation analysisBullish Trend ReversalBullish trend reversal analysisBullish trend reversal behaviorBullish trend reversal psychologyBullish trend reversal psychology analysisBullish trend reversal signalBuying pressureCandlestick analysisCandlestick ChartingCandlestick Formationcandlestick patternCertainlyChart AnalysisChart patternChart pattern analysisChatGPTFinancial Marketshere are 300 keywords related to the "Bullish Engulfing" candlestick pattern:Japanese CandlesticksList 300 keywords related to "Bullish Engulfing"Market AnalysisMarket analysis toolsMarket behaviorMarket behavior analysisMarket behavior movementMarket behavior movement analysisMarket behavior sentimentMarket behavior sentiment analysisMarket behavior sentiment movementMarket behavior sentiment movement analysisMarket behavior sentiment movement psychologyMarket behavior sentiment psychologyMarket behavior sentiment psychology analysisMarket behavior validationMarket indicatorsMarket interpretationMarket momentumMarket momentum analysisMarket MovementMarket movement analysisMarket movement analysis techniquesMarket movement validationMarket PsychologyMarket psychology analysisMarket psychology behaviorMarket psychology interpretationMarket psychology movementMarket psychology movement analysisMarket psychology trendMarket psychology validationMarket psychology validation analysisMarket reversalMarket reversal analysisMarket reversal behaviorMarket reversal signalMarket reversal trendmarket sentimentmarket sentiment analysisMarket sentiment validationMarket trendMarket trend reversalPrice ActionPrice Action AnalysisPrice breakoutPrice ChartPrice confirmationPrice confirmation movementPrice confirmation signalPrice momentumPrice MovementPrice Movement AnalysisPrice movement analysis methodsPrice movement analysis modelsPrice movement analysis techniquesPrice movement analysis toolsPrice movement behaviorPrice movement confirmationPrice movement confirmation analysisPrice movement interpretationPrice movement momentumPrice movement momentum analysisPrice movement momentum validationPrice movement patternsPrice movement psychologyPrice movement psychology analysisPrice movement reversalPrice movement reversal confirmationPrice movement sentimentPrice movement sentiment analysisPrice movement sentiment behavior analysisPrice movement sentiment behavior psychologyPrice movement sentiment psychologyPrice movement sentiment psychology movementPrice movement sentiment psychology validationPrice movement sentiment validationPrice movement sentiment validation analysisPrice movement signal analysisPrice movement signal psychology analysisPrice movement signal validationPrice movement signalsPrice movement trendsPrice movement validationPrice pattern analysisPrice pattern behaviorPrice pattern confirmationPrice pattern movementPrice pattern movement analysisPrice pattern movement psychologyPrice pattern psychologyPrice pattern psychology analysisPrice pattern sentimentPrice pattern sentiment analysisPrice pattern sentiment behaviorPrice pattern sentiment behavior validationPrice pattern sentiment psychologyPrice pattern sentiment psychology movementPrice pattern sentiment psychology movement analysisPrice pattern sentiment psychology validationPrice pattern sentiment validationPrice pattern validationPrice PatternsPrice ReversalPrice trendPrice Trend AnalysisPrice trend confirmationReversal patternReversal signalStock chart patternStock marketTechnical AnalysisTechnical analysis indicatorsTechnical Analysis ToolsTechnical analysis validationTechnical chartTechnical chart analysisTechnical indicatorTechnical indicator analysisTrading signalTrading strategyTrend confirmationTrend confirmation behaviorTrend confirmation behavior analysisTrend confirmation behavior psychologyTrend confirmation behavior psychology analysisTrend confirmation behavior validationTrend confirmation movementTrend confirmation psychologyTrend confirmation psychology analysisTrend confirmation signalTrend ReversalTrend reversal analysisTrend reversal behavior analysisTrend reversal behavior movementTrend reversal behavior psychologyTrend reversal behavior psychology validationTrend reversal behavior sentimentTrend reversal behavior sentiment analysisTrend reversal behavior sentiment validationTrend reversal confirmationTrend reversal movementTrend reversal psychologyTrend reversal psychology analysisTrend reversal psychology validationTrend reversal sentimentTrend reversal sentiment analysisTrend reversal signal confirmationTrend reversal validationUptrendUptrend analysisUptrend behaviorUptrend behavior analysisUptrend confirmationUptrend confirmation analysisUptrend confirmation signalUptrend continuationUser
Previous Post

Nvidia Stock Tumbled From its Record High

Next Post

India’s Aerospace Stocks Soared Over the Past 6 Months: Chandrayaan-3 Impact!

James Albert

James Albert

James Albert is a personal-finance analyst for FintechZoom and is based in New York. Contact: [email protected]

Related Posts

A small model jet and a golden bull figurine sit on a desk, with multiple computer screens in the background displaying green financial charts and stock market data, hinting at the rising interest in defense stocks. | FintechZoom

Defense Stocks Soar: Is This The Perfect Time to Invest in 2025?

May 8, 2025
A computer monitor displays the best share trading platform with multiple windows showing stock charts, graphs, and various market data. The interface is predominantly dark with green, red, and blue elements indicating different metrics and performances. | FintechZoom

Why is it Important to Choose the Best Share Trading Platform?

May 7, 2025

Things to Consider When Buying an Apartment

May 1, 2025

GMZ Global Experts Share Why a Regulated Broker Matters for Your Trading Success

March 13, 2025

FintechZoom.com Insights: How Is Data Used In Modern Investing?

March 5, 2025

Andy Gitipityapon Talks DSTs and Alternative Investment Vehicles

March 5, 2025

Day Trading Made Easy: How FintechZoom.com Supports Active Traders

February 24, 2025

How to Master Equity Capital Markets: A Beginner’s Guide That Actually Makes Sense

February 15, 2025

Online Trading Broker FXGiants Enhances Trader Experience with Bonus Programs

February 11, 2025

Leave a Reply Cancel reply

Your email address will not be published. Required fields are marked *

  • About Us
  • Advertise
  • Careers
  • Terms and Conditions
Call us: + 1 917 9939840

© 2016-2023 FINTECHZOOM

No Result
View All Result
  • MARKETS
    • Stock Market
      • Penny Stocks
      • Stock Market Guides
      • Breaking Stock Market News
      • Reviews in Stock Market
      • Best Stocks To Buy Now
      • Asian Markets
      • European Markets
      • US Markets
      • Trading
      • Stock Futures
    • Forex Market
    • Bonds & Rates
    • Commodities
      • Brent Crude Oil Price
      • WTI Crude Oil Price
      • Natural Gas Live Prices
      • Gold Live Prices
      • Silver Live Prices
      • Nickel Live Prices
      • Platinum Live Prices
      • Corn Live Prices
      • Wheat Live Prices
    • Exchange Traded Fund (ETF)
    • World Indices
      • DAX PERFORMANCE-INDEX
      • Russel 2000 (RUT)
      • STOXX Europe 600 (SXXP)
      • Euro Stoxx 50
      • CAC 40 Index (FCHI)
      • FTSE 100 Index
      • Nikkei 225 Index
      • HSI – Hang Seng Index
      • NSE Nifty 50 Index
      • NASDAQ Composite Index
      • Dow Jones (INDEXDJX: .DJI)
      • S&P 500 Index
      • ASX – Australian
      • Shanghai Index (SSE)
  • BUSINESS
    • Fintech
    • Technology
      • Cybersecurity
      • Youtube Tools
      • Instagram Tools
      • Social Media
      • Internet
      • Digital Library
    • Artificial Intelligence
    • Finance
    • Health
    • Real Estate
    • Climate
    • Sports
    • Legal
  • CRYPTO
    • Crypto Guides
      • How To Buy Bitcoin
    • Metaverse
    • Tokens
    • Crypto Reviews
    • NFT : Non-Fungible Tokens
    • Stablecoins
    • Blockchain
    • Ethereum
    • Buy Bitcoin
    • Best Crypto
    • Bitcoin
    • Altcoins
  • MONEY
    • Insurance
    • Mortgages
    • Loans
    • Personal Finances
    • Credit Cards
    • Interest Rates
    • Banking
      • Banks Near Me
      • Payments
      • ATM Near me
      • Best Banks
      • Banks Guides
      • Transfer Money Online
      • Mobile Banking
      • Digital Bank
      • Secure Bank Login
  • ECONOMY
    • Investment
    • Taxes
    • Jobs
    • Inflation
  • LIFESTYLE
    • Travel
    • Luxury
      • Luxury Food & Drink
      • Luxury Watches
      • Luxury Cars
      • Luxury Style
      • Luxury Motors
      • Luxury Travel
      • Luxury Tech
    • Fashion & Beauty
    • Entertainment
      • Gaming
      • Movies
      • Streaming Services
      • eBooks
      • Anime & Cartoons
    • Cars
    • Near Me
    • Life
    • Weather Tomorrow
  • ABOUT US
    • Why Fintech Zoom?
    • What is FintechZoom?
    • Advertise with Us
    • Careers in FintechZoom: Carving Your Path
    • Fintech Zoom Logo
    • FintechZoom PRO
    • FintechZoom Contacts: Best Ways to Connect with FintechZoom
  • OUR SERVICES

© 2016-2023 FINTECHZOOM

Are you sure want to unlock this post?
Unlock left : 0
Are you sure want to cancel subscription?