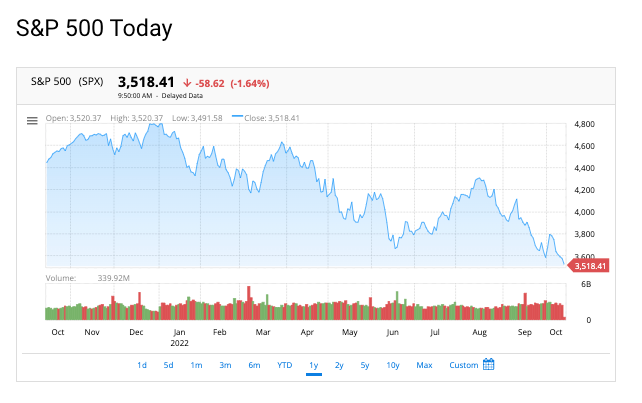
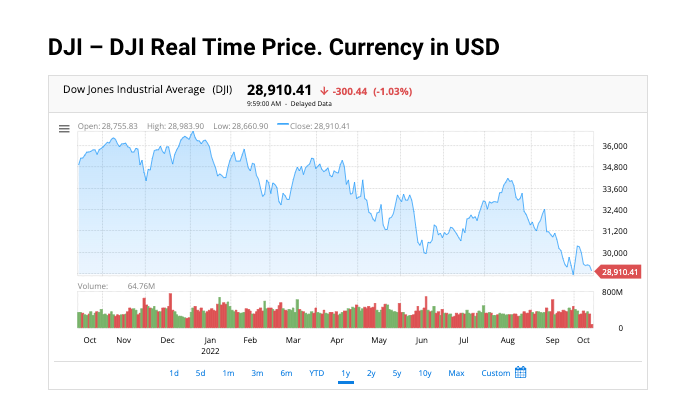
Do you want to know more about the DJIA ? Here is everything you need to know. The Dow Jones Industrial Average (DJIA) is a stock market index made up of 30 large, publicly traded companies in the United States. It is often used as a measure of the overall performance of the US stock market. The components of the DJIA are reviewed and changed occasionally by a committee of analysts at S&P Dow Jones Indices, which is responsible for maintaining the index. Let’s take a closer look at some of these companies!
The Dow Jones Industrial Average (DJIA) Brief History
1. The Dow Jones Industrial Average (INDEXDJX: .DJI), also called the Dow 30, is a stock market index that indicates the value of 30 large, publicly owned companies based in the United States.
2. The DJIA is the second oldest U.S. market index after the Dow Jones Transportation Average, which was also created by Dow Jones & Company co-founder Charles Dow.
3. The DJIA is a price-weighted average, meaning that its components are weighted according to their share prices rather than by their market capitalization.
4. The DJIA is one of the most widely quoted stock market indices in the world and is often used as a barometer for the health of the U.S. economy.
5. The DJIA was first published on May 26, 1896 and has been calculated continuously since October 1, 1928.
6. The DJIA is named after its creators, Dow Jones & Company co-founders Edward Jones and Charles Dow.
7. The DJIA was created as a way to measure the performance of the industrial sector of the U.S. economy and it originally consisted of 12 Dow Jones stocks from companies such as General Electric and American Tobacco Company.
8. In 1916, the number of stocks in the DJIA was increased to 20 and in 1928 it was expanded to its current 30 stocks.
9. The components of the DJIA are reviewed and changed occasionally by a committee of analysts at S & P 500 Dow Jones Indices, which is responsible for maintaining the index.
What are the best websites about Dow Jones index with news published few hours ago?
When it comes to keeping up with the latest news about the Dow Jones index, there are dozens of websites and resources out there that can help.
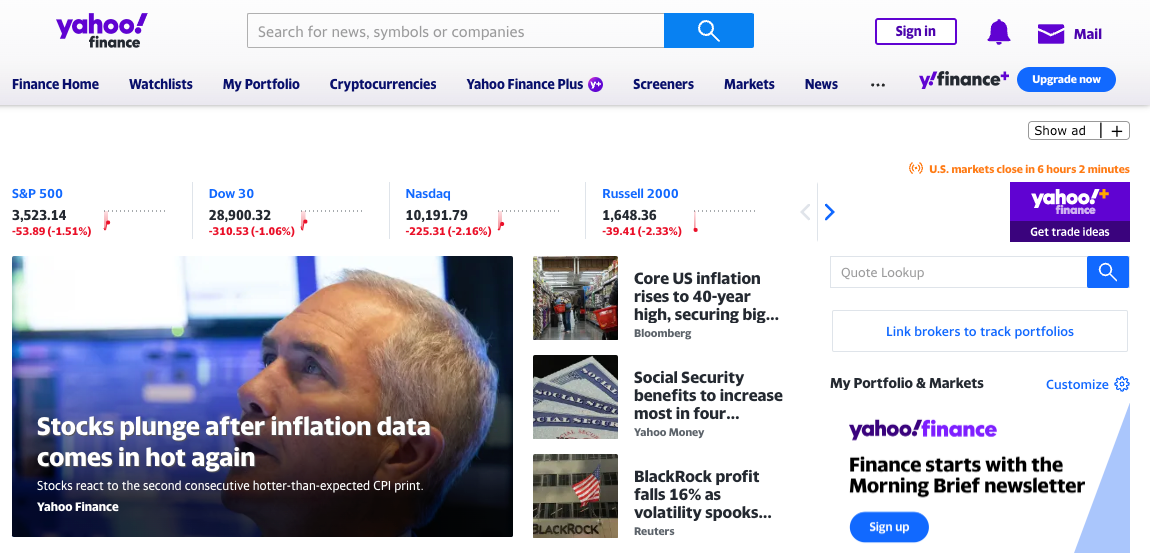
Perhaps the most well-known of these resources is Yahoo Finance, which has comprehensive coverage of all aspects of the index, including vital information about market performance and individual stocks.
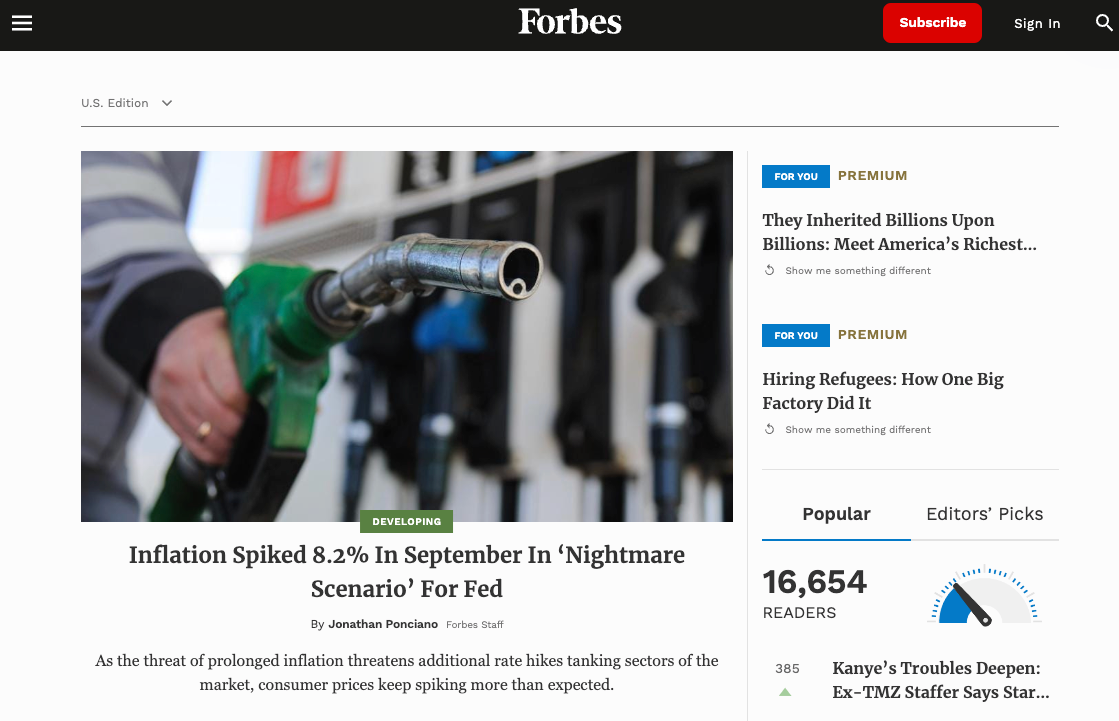
Other top sites for Dow Jones index news include CNN Money, Forbes, FintechZoom and MarketWatch.
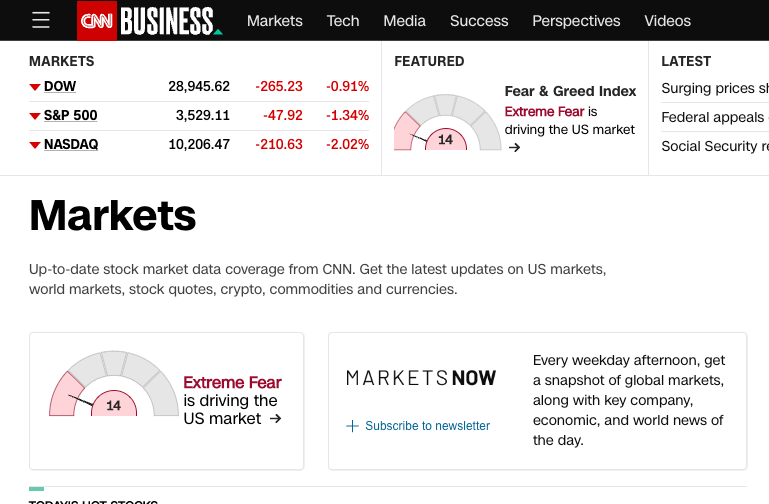
These resources offer a wide range of reporting on recent developments in the market as well as insightful commentary and analysis. Additionally, many sites also include real-time information updates as well as interactive tools such as stock valuation calculators and risk simulations.
Overall, if you’re looking for the best websites for up-to-date Dow Jones news, there’s certainly no shortage of options available!
Dow Jones – Stock Market Graph Today
The Dow Jones is one of the most well-known stock market indices in the world. It is an indicator of how the overall stock market is performing, tracking the performance of 30 large companies that are listed on either the New York or NASDAQ exchanges. Today, the graph for the Dow Jones looks quite positive, with a steady upward trend that has been gaining momentum over the past year.
This suggests that investors are generally confident about the future direction of the stock market, and indicate that there may be more opportunities for growth in the months to come. Whether you are a seasoned investor or just getting started, it is important to track changes in the Dow Jones so that you can stay ahead of any potential risks or trends that might affect your portfolio. So stay tuned and keep an eye on this important indicator to get ahead in today’s fast-paced markets!
Where I can Find Dow Jones Industrial Average Live Charts?
If you are looking for Dow Jones live charts, there are a number of places where you can find them. For stock market investors, the most popular source is probably Nasdaq, which offers real-time stock data and interactive stock charts for a variety of different stock indices.

Other popular sources for Dow Jones live charts include financial news websites like Bloomberg and Reuters, as well as stock analysis tools like Fidelity and TD Ameritrade.
No matter where you look, though, it is important to ensure that your chart data is up-to-date and accurate in order to make informed investment decisions. With the right information, you can stay on top of the latest trends in the stock markets and take full advantage of the opportunities they present. Good luck!
How Can I Trading in Dow Jones?
There are several different ways that you can trade in Dow Jones, depending on your level of experience and comfort with the markets. If you are new to trading but want to participate in the world’s largest stock market, then you might start by using a broker or brokerage account. These platforms typically offer a wide range of tradable assets, and they make it easy to get started with your investments.
However, for more experienced traders who are looking for more sophisticated tools and trading strategies, there are other options as well. Some investors choose to participate directly in the markets through online trading platforms that allow them to place limit orders and build more complex investment portfolios.
Ultimately, which trading method is right for you will depend on your goals as an investor and how comfortable you feel facing the uncertainty of the market. But whatever option you choose, investing in Dow Jones has the potential to be a rewarding and profitable experience.
What is Dow Jones Futures?
Dow futures are a highly-regarded financial indicator that is used to predict trends in the global stock market. These futures are derived from values of 30 key stocks in the Dow Jones Industrial Average and updated daily to reflect changes in the market. Because they are based on real-world market trends, they can provide valuable insight into shifts in investor sentiment.
As a result, many investors, financial professionals, and analysts closely monitor Dow futures as a barometer for overall economic health. Whether you’re looking to make informed stock trades or simply curious about current conditions in the markets, it’s important to keep track of Dow futures closely. With their reliable and up-to-date information, these tools can help you stay ahead of the curve and make intelligent decisions about your investments.
How to analyse Stock Market Charts?
Analyzing stock market charts can be a complicated and time-consuming act. The first step is to choose an appropriate log scale, since log charts are much easier to interpret than linear charts. In addition, it is important to avoid using the right click function, as this can result in unwanted chart adjustments and data disruptions.
Instead, you should use long presses to zoom in and out of your chart for greater control over your analysis. Additionally, it is important to establish an anchor time for your chart at the beginning of your analysis, so that you always have a clear reference point from which to work.
Finally, if you want to change the anchor time based on newer information, simply use a long press at new anchor points on the chart and drag your cursor up or down as needed. With these tips in mind, you should be able to easily analyze stock market charts and make accurate investment decisions.
Traders use chart patterns to identify stock price trends
Chart patterns are widely used by traders as a way to identify potential trends in stock prices. These patterns can change depending on the time frame that is being analyzed, also known as the anchor time. Some of the most common chart patterns include wedges and flags, both of which often indicate a change in trend direction. Another important element of chart patterns is the act of deleting right clicks, which can help to prevent people from changing their analysis and obtaining potentially false information. When used effectively, chart patterns can be useful tools for identifying and predicting market changes, allowing traders to make more informed decisions about when to buy or sell stocks. Ultimately, traders who understand how to use chart patterns are better equipped to take advantage of market movements and successfully navigate the ever-changing landscape of financial markets.
Conclusion
The DJIA, or Dow Jones Industrial Average, is a widely-tracked barometer of market performance. This index is comprised of 30 major companies, each chosen because of its significant size and influence on the US economy.
Over the years, this index has come to be seen as a reliable indicator of economic health, with both professional investors and casual observers following its progress in order to predict trends in the wider market. While no one can accurately predict the future directions of the DJIA, there are some general conclusions that we can draw from its behavior over time.
For one thing, it is clear that growth in the Dow is not a guarantee – stock prices are often subject to significant volatility, rising and falling based on internal and external factors beyond our control. Additionally, however consistent we may try to be with our trading strategies, there always remains an element of risk when investing in any market or product. Ultimately, then, when approaching the DJIA or any other financial instrument for that matter, it is crucial to remain aware and adaptable – accepting that nothing lasts forever while recognising that with careful analysis and attention to detail we can foster sustainable success over time.

